Calculate Z Score in Excel
The function to calculate z-score in Excel is STANDARDIZE(). This function accepts input parameters like data set, mean, and standard deviation. To calculate the mean and standard deviation, use the AVERAGE(x1 : xn ) and STDEV.S(x1 : xn ) functions in Excel.
The Z-score is a measure of how many standard deviations an observation or data point is from the mean. It’s important for statistical analysis and research because it tells us whether a result is significant or not at a certain level of confidence.
If the population mean and population standard deviation are known, the Z score is calculated using the below formula
z = (x -μ )/σ
Where: μ = is the population mean σ = is the standard deviation of the population x = is the raw score value
z = is the calculated z-score value
In this post, we will learn how to calculate z scores in Excel as well as find z scores in excel for raw data values.
How to Calculate Z Score in Excel
Let’s understand how to calculate z-score in excel step by step as given below
Prepare Dataset in Excel
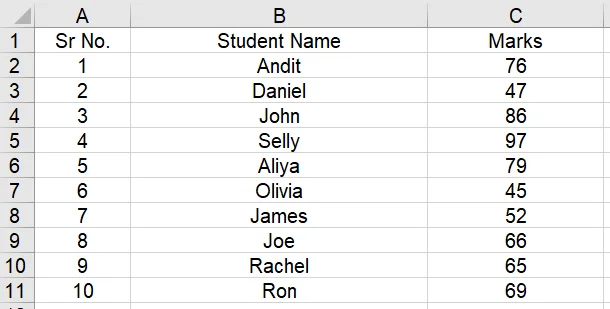
Let’s consider an example of student marks and we would like to find z scores for each student.

To calculate z scores in Excel for the given student’s data set, we have to calculate the basic parameters for the data set i.e. mean and standard deviation.
Find the mean value of the dataset in Excel
Use the student dataset to calculate the mean value of raw data using the AVERAGE() formula in Excel.
Notation :- AVERAGE(x1 : xn )
Where,
x1 = first data value in excel sheet
xn = last data value in excel sheet
We have student marks data in C2 cell to C11, put cell numbers in the formula below to get the mean value
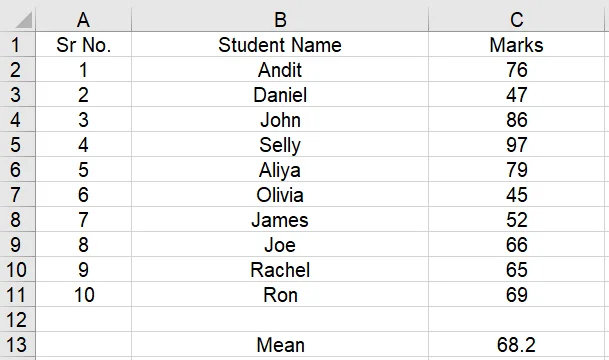
The AVERAGE function in excel calculates the mean value for raw data as shown in the below image.

The mean value for the student’s data set is 68.2.
Find the standard deviation for the dataset in Excel
Use the STDDEV.S() formula in Excel to calculate the standard deviation for the data set.
Notation :- STDEV.S(x1 : xn )
Where,
x1 = first data value in excel sheet
xn = last data value in excel sheet
We have students marks data in cell C2 to C11, and put cells numbers in the formula given below
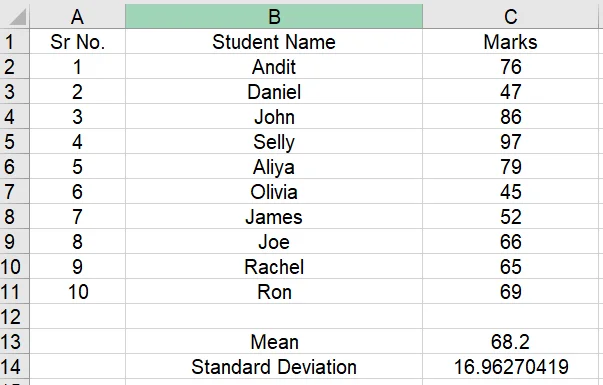
STDEV.S() function in excel calculates the standard deviation for the students marks as shown in the below image.

The standard deviation value for the student’s data set is 16.96270419.
Calculate Z Score in Excel for Raw Data
Excel provides STANDARDIZE() function to calculate the z-score value.
STANDARDIZE() formula in excel returns the normalized value from distribution using mean and standard deviation.
To find the z-score in excel, STANDARDIZE() function required the data set, mean, and standard deviation of the data set. These values has been calculated in the earlier steps.
Notation :- STANDARDIZE(xm ,$m,$sd)
Where,
xm = data value in excel sheet whose z-score is calculating
m = calculated mean cell in excel sheet
sd = calculated standard deviation cell in excel sheet
Find the Z score value for the first raw data
First, find the z score value for the first raw data value using STANDARDIZE() method as given below
STANDARDIZE(xm ,$m,$sd)
In the above formula,
C2 = First student marks
C13 = mean value for the dataset
C14 = Standard deviation.
D2 = contains the calculated Z score value using the above formula
Now, we don’t have to repeat the entire process to find the Z score in excel for the remaining 9 data values. Cell D2 contains the formula to calculate the Z score as shown in the above steps.
To calculate z scores value for the remaining data values in the dataset,
We have to use the Mean and Standard_dev field in STANDARDIZE() method, we make it constant by using the $ sign before the mean and standard deviation cell, for example, $C$13 and $C$14
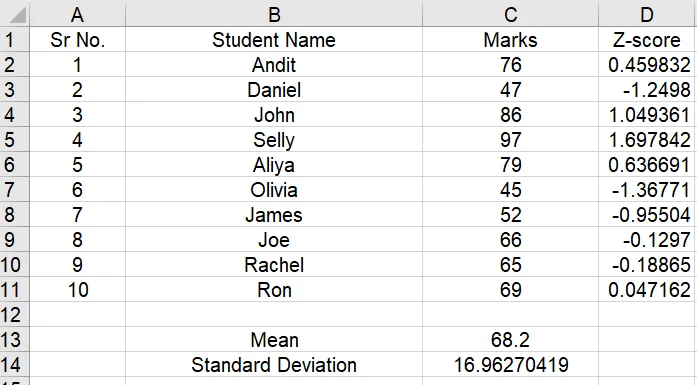
Drag cells D2 to D11 to use the same STANDARDIZE() method to find the z score for each raw data in a given dataset.
The output is given below.

Calculate Z-score in Excel
Note:- Please use $ before the mean cell and standard deviation cell used like above in order to make their entries common so that on dragging the cell we will get the correct results.
Find Z Score using Z-Score Formula
In the above steps, we have used STANDARDIZE() method in excel to calculate a z-score value for each value in the dataset.
Alternatively, we can use the Z-Score formula to find z score in excel for each raw data using
Z score value for first data in Cell E2 using Z score formula
Z score = (x -μ )/σ
z = (C2 – $C$13)/$C$14
Z Score = 0.459832342
Now to find z scores for each data, drag the Cell E2 till E11
Interpret Z scores in Excel
A positive z-score value indicates the value is greater than the mean value.
A negative z-score value indicates the value is less than the mean value.
In our above example to find the z scores for students, let’s consider an example of an example of a first student.
The first student z score value is 0.459832342, which means that the student name Andit marks 76 is 0.459832342 standard deviation above the mean.
Cool Tip: How to use the z-score table chart to determine the probability of z score value!
Conclusion
I hope the above article on how to calculate the z score in excel with step by step guide is useful to you.
In the above post, we have learned, how to calculate the mean, and standard deviations for the data set and use STANDARDIZE() method to find the z score for each student.
Alternatively, you can use the z score formula in excel to find z score values using student raw score values, mean of the distribution, and standard deviation of the dataset.
Cool Tip: Read more about how to find percentiles from z score on the TI-84 calculator!
You can find more topics about Z-Score and how to calculate z-score given the area on the ZscoreGeek home page.