Z Score Table and Chart (How to use Z-Score)
Z table or the Z-score table also called the standard normal table is a mathematical table used to find the probability that the z-score value is below, above, or between the values on the standard normal distribution.
Standard scores are most commonly called z-scores. In this post, equivalent terms like z-values, standardized variables, and normal scores are used.
The standard normal distribution table is the normal distribution having a mean value of 0 and a standard deviation of 1.
The standard score value gives you how far the raw score value is from the mean.
The Z-score value either be Positive or Negative depending on raw score value is greater than the mean or less than the mean.
The positive Z score value represents the raw score value is higher than the mean of the distribution. Use the Z score table pdf file to determine the corresponding area or probability to a positive z score value.
For example, the z-score value of 2 indicates it is 2 standard deviations greater than the mean.
A negative Z score value indicates the raw score value is below the mean of the distribution. Use the negative z table pdf file to determine the probability of a negative z score value.
Positive Z Score Table
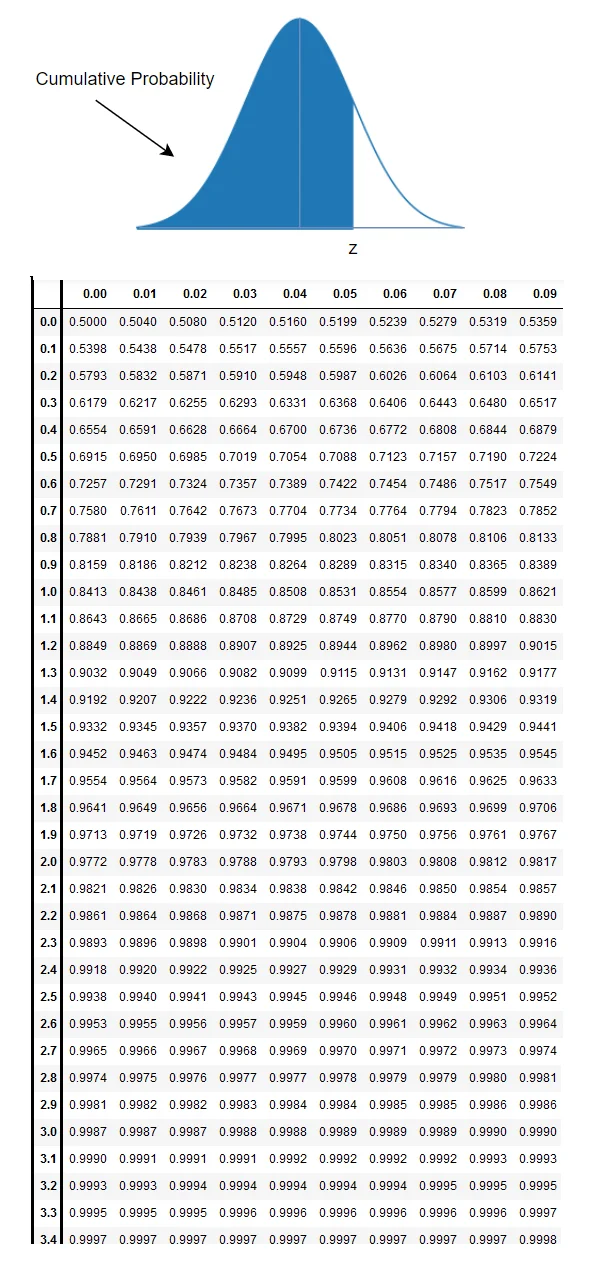
Use the standard normal distribution table or z table chart to find values on the right of the mean distribution.
Corresponding values are higher than the mean of the distribution.
The positive z score in the z-table represents the area under the bell curve to the right of z.
Negative Z Score Table
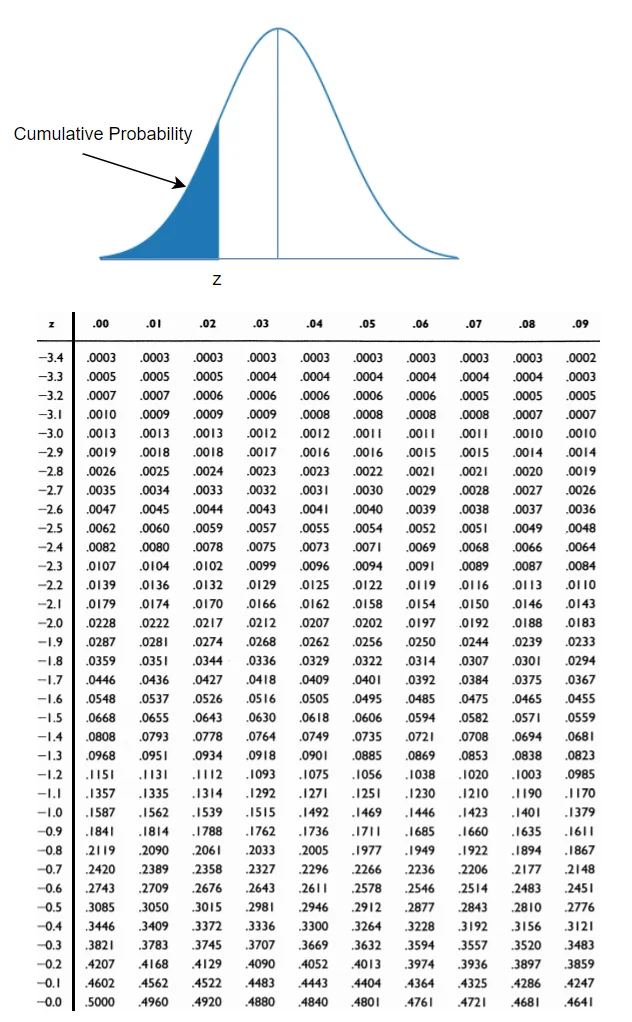
Use the Negative Z score table or Z table chart to find values on the left of the mean distribution in the following z table.
Corresponding values are less than the mean of the distribution. The negative z score in the z-table represents the area under the bell curve to the left of z.
How to read Z Table
Z table is used to find the z score value lies on the left of the mean or right of the mean distribution.
To use the Z table, you should have a Z score value.
You can refer Z score calculator article which explains how to calculate the Z score using the z score formula below
z = (x -μ )/σ
Where: μ = is the population mean for the unstandardized value σ = is the population standard deviation for the unstandardized value x = is the raw score value
z = is the calculated z-score value.
If the z score value is positive, use the positive z table to find the area on the right of the mean of the distribution.
If the z score value is negative, use the negative z table to find an area on the left of the mean of the distribution.
Let’s consider an example to find the z score value and corresponding probability.
We have below the inputs parameter
The mean of the population for the unstandardized value = 75
The population standard deviation for the unstandardized value = 15
Raw Score Value: 83
Using the above input values as per the Z score formula, it calculates the Z score value below
Z score = (83 – 75)/15 Z = 0.54
Now as we have the Z score value, use the z table chart.
The z score value is positive hence we will use the positive z table chart to find an area on the right of the mean.
To find a z-score using the table, look up the z-score value on the positive z-score table.
Find the first two digits of the z score to map it on the Y-axis of the normal distribution table, in our case first, two digits are 0.5
Find the value of digits at the second decimal position in z score value, it is 0.04
In the below z table, the yellow color box indicates the mapping of the z score value on the Y-axis and X-axis to find the corresponding area as marked in red color
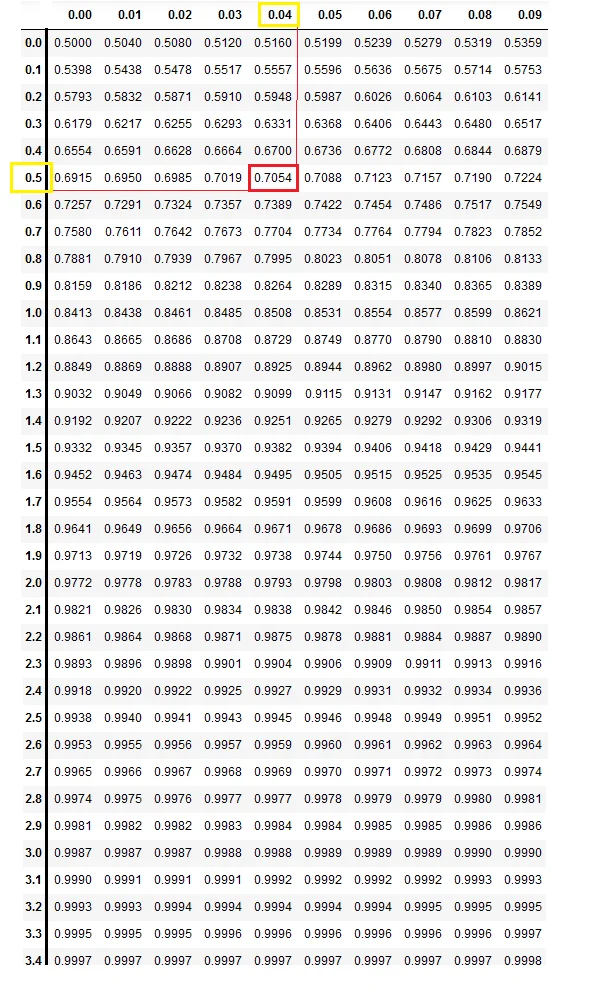
The corresponding area is 0.7054 which means 70.54%
For the normal standard curve, what percent of the data values are below the third quartile denoted by Q3, and also find the z-score corresponding to Q3?
We know the Q3 Quartile represents the 75th percentile in the standard normal distribution.
It means there 75% of the data values lies below the third Quartile in the standard normal distribution.
Let’s first draw the normal distribution curve for percentile = 0.75
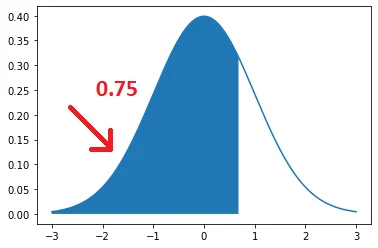
To find the z-score for the 75th percentile, we will follow the below steps
Step-1
Go to the z score chart and check the probability closest to 0.75 in the values inside the table.
Sometimes the exact values do not exist, in that case, we will consider the best closest value.
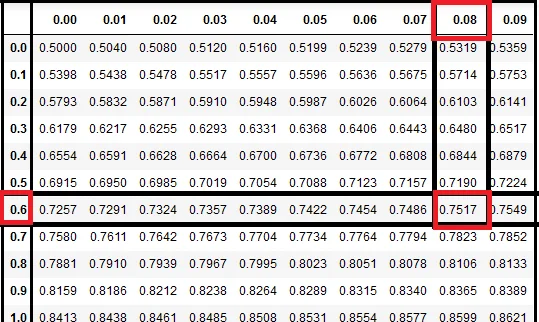
The closest value in the Z-table is 0.7517
Step-2
Find the z-score corresponding to this value i.e in this case its corresponding row value is 0.6 and its corresponding column value is 0.08
Step-3
Combine these numbers as 0.6+0.08 = 0.68
Conclusion
The Z-score for the Q3 Quartile is 0.68 which means 75% of the data point of the normal distribution is below 0.68 z-score.
Z-Score Percentile Table for Normal Distribution
The below table displays the z-score percentile table for the standard normal table
| Percentile | Z-Score |
|---|---|
| 5 | -1.645 |
| 10 | -1.282 |
| 20 | -0.842 |
| 40 | -0.253 |
| 50 | 0 |
| 60 | 0.253 |
| 80 | 0.842 |
| 85 | 1.036 |
| 90 | 1.282 |
| 95 | 1.645 |
| 97 | 1.881 |
| 98 | 2.054 |
| 99 | 2.326 |
Z Score Percentile Table for Normal Distribution
Z Value Table for Confidence Intervals
To find the z score for the confidence intervals, use the below table.
| Confidence Interval ((1–α) * 100%) | Significance level (α) | Critical Z-Value (Z-score) |
|---|---|---|
| 80% | 0.20 | 1.282 |
| 85% | 0.15 | 1.439 |
| 90% | 0.10 | 1.645 |
| 95% | 0.05 | 1.960 |
| 97% | 0.03 | 2.17 |
| 98% | 0.02 | 2.326 |
| 99% | 0.01 | 2.576 |
| 99.5% | 0.005 | 2.807 |
| 99.8% | 0.002 | 3.090 |
| 99.9% | 0.001 | 3.291 |
What’s the difference between Z-Score vs Percentile?
Z-Score:
- Z-score measures how much a z-score deviates from the mean of the distribution in terms of standard deviation.
- It tells us about the position of the data value in the normal distribution.
- It describes the distance between two extreme data points in the distribution very accurately.
- Z-score ranges from −∞ to ∞
- It can be used only in the case of normal distribution.
Percentile:
- The Percentile indicates the percentage of data values lies below the certain z-value in the distribution.
- It only tells us about the fraction of data values lies below the data value but does not specify their positions in the distribution.
Z Score Table Pdf
You can download the z score table pdf file having the positive z score chart and negative z score chart in pdf file from given below link.